Predictive Modelling
AssetAsyst includes a predictive modelling tool to help users understand the long-term life of their assets, from a financial and condition-based perspective. The predictive modelling tool currently works with Structure and custom point assets.
Setting up the data
In order to get meaningful information out of the predictive modelling tool, there are various inputs that feed into the algorithm, which need to be entered. Much of the data will already be present if you are using AssetAsyst to its full potential, such as inspections, defects and work orders. Most of the remaining information can be entered in the unit tab of the structure asset form.
Current Cost
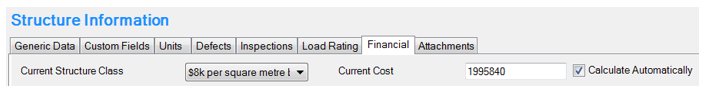
The predictive modelling tool needs to know the current cost of each component (essentially construction cost in today’s dollars). We already store the current cost at the asset level, which you can find in the financial tab of a structure asset, or the Asset Information tab of a custom asset.
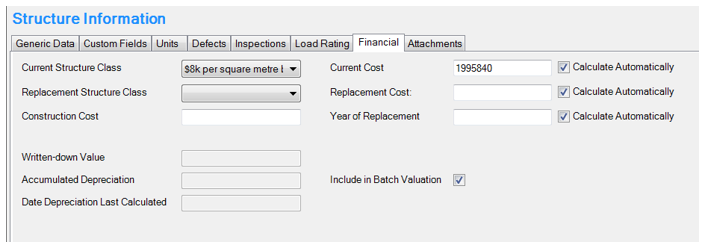 In the case of the pictured example, you will notice that the current cost has been automatically calculated by AssetAsyst from the current structure class (which provides a unit rate per square metre) and the geometry in the generic data tab.
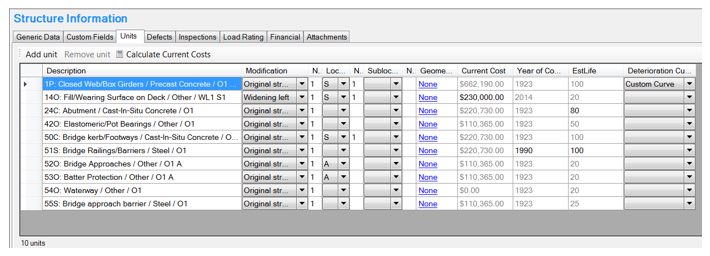
In the Units tab, we also have Current Cost. All figures in grey are automatically calculated by AssetAsyst. All figures in black have been entered by the user:
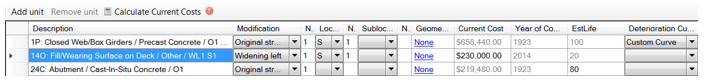
Notice the warning symbol next to the Calculate Current Costs button? It means that the sum of the amounts in the Current Cost column does not match the total cost of the Asset. If you click Calculate Current Costs, AssetAsyst will automatically re-balance the sum by adjusting the calculated fields.
Current Cost Setup
To automatically calculate the cost of a Unit, AssetAsyst needs a couple of things. First of all, the Current Cost for an Asset needs to be set:
Second, AssetAsyst uses a general setting called Cost Weight to allocate the percent (of the Asset cost) to the Unit. This can be found in the Relationships tab in the Component/Materials dialog:
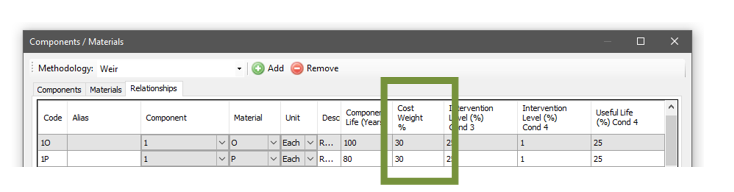 Note that this needs to be set per Unit per Methodology. Currently, AssetAsyst includes defaults for VicRoads.
Year of Construction
AssetAsyst will automatically calculate the year of construction for a unit, based on the year of construction of the asset. If the modification has been filled in, it will use the year of construction for that modification. For example, if the unit is on widening left 1, the year of construction for WL1 will be used.
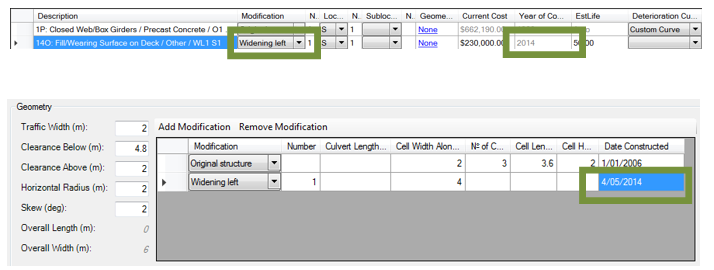
If you desire, you can manually override the year of construction. Calculated values show as light grey. Manually edited values show as black.

Estimated Life
To model the deterioration of a unit, AssetAsyst needs an estimated life for that unit. AssetAsyst will pre-fill this column with a standard life expectancy based on the component type. You can find this value under the tools menu, in the Component Material screen.
 If desired, you can manually edit the estimated life for the unit in the column.
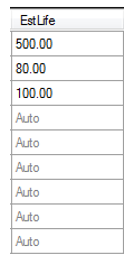
NOTE: if you specify an exposure class for this unit on the level 2 inspection, AssetAsyst will make use of this information to produce an even more accurate estimated life.
In order to proceed with the deterioration modelling, AssetAsyst requires a completed level 2 inspection for the asset.
Deterioration Curves
Deterioration is modelled over time using a deterioration curve. You can set the Deterioration Curve in the Units tab:

You don’t have to set a Deterioration Curve – if you leave it blank then the “Default Curve” will be used during modelling instead.
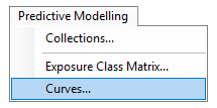
To manage the list of Deterioration Curves, in the menu choose Predictive Modelling | Curves
Then you’ll see a dialog similar to the following:
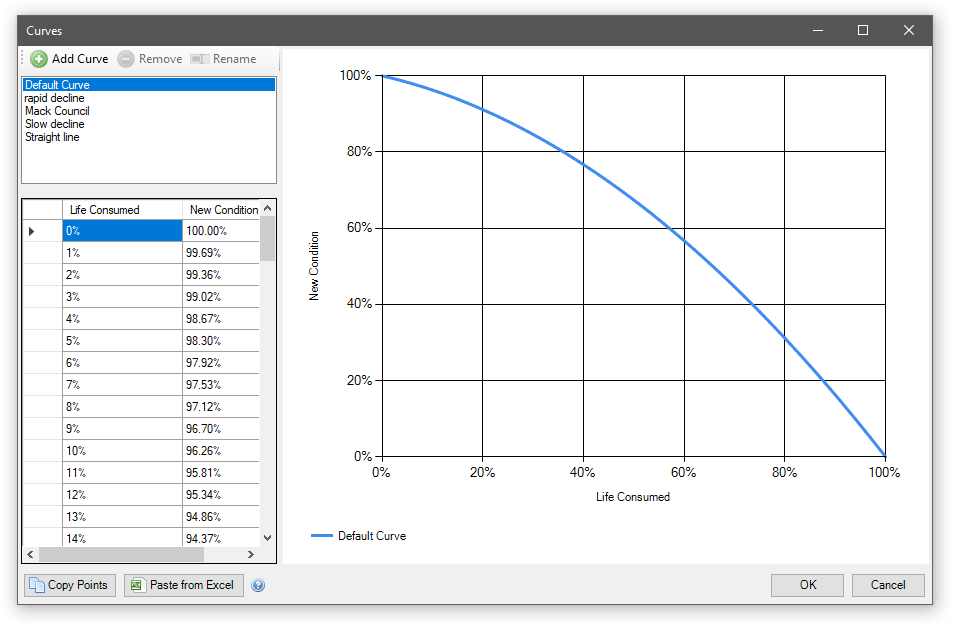
To add a new curve, click the Add Curve button and give it a name:

Adding points to the grid will update the graph:
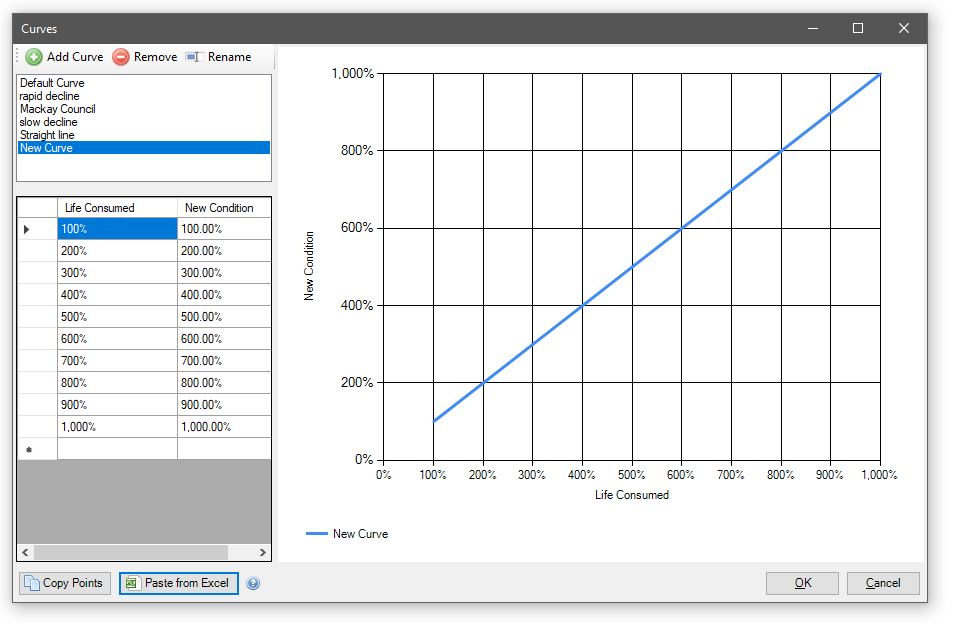
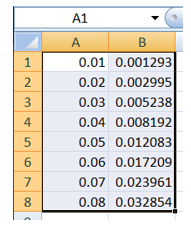
If you have a list of points in an Excel spreadsheet, then you can use the Paste from Excel feature. For example, in the following Worksheet two columns are selected:
If these cells are copied, they can be pasted into the curve point data by clicking the Paste from Excel button. In the following screen, points 1,1 and 2,2 have been removed. The above data has been pasted in:
Save your changes by clicking OK.
Running the Modelling
From the Predictive Modelling menu, choose Collections.

Then click the Add Collection button.

Enter a name for the collection and choose a methodology.

Select the desired structures.

Take note of any missing data. You will need to resolve all red validation issues before you can proceed. Orange validation issues serve as warnings, but do not prevent you from continuing.
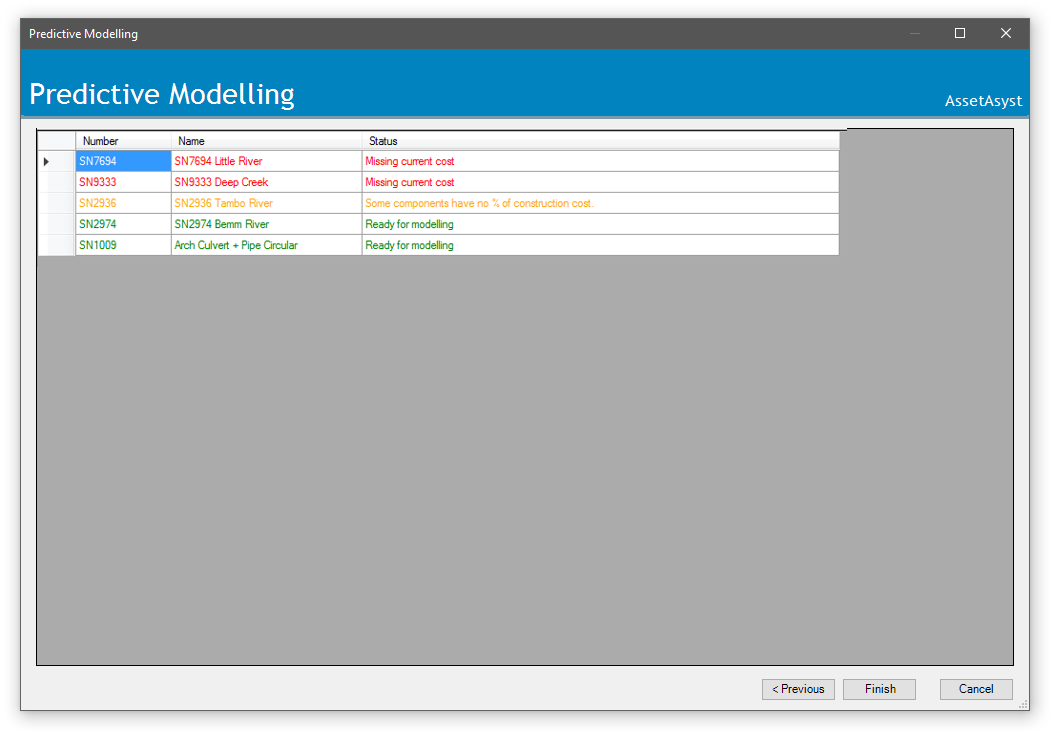
When the data is valid, click Finish. AssetAsyst will deteriorate the selected structures.
There are two reports that can be run on a predictive modelling collection.
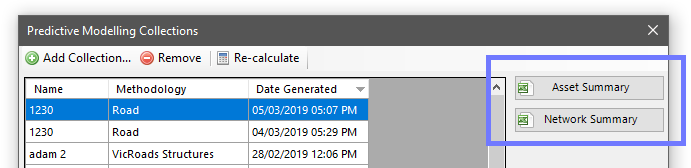
The Asset Summary report will create an excel spreadsheet for each asset in the collection.
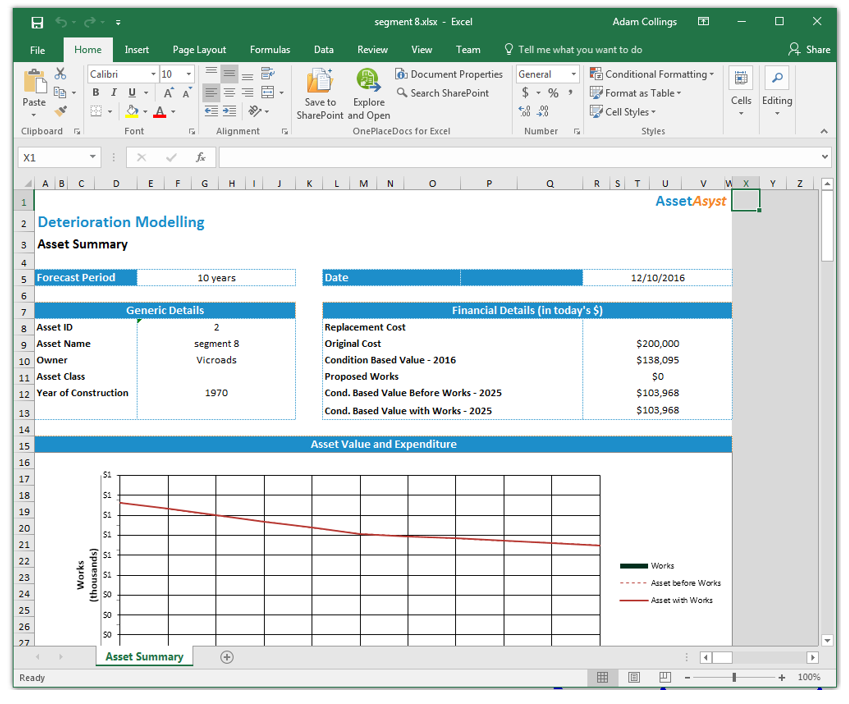
In addition to the spreadsheets, AssetAsyst will also generate a file called _Export to PDF.xlsm”

Open this file to convert the reports into PDF format.
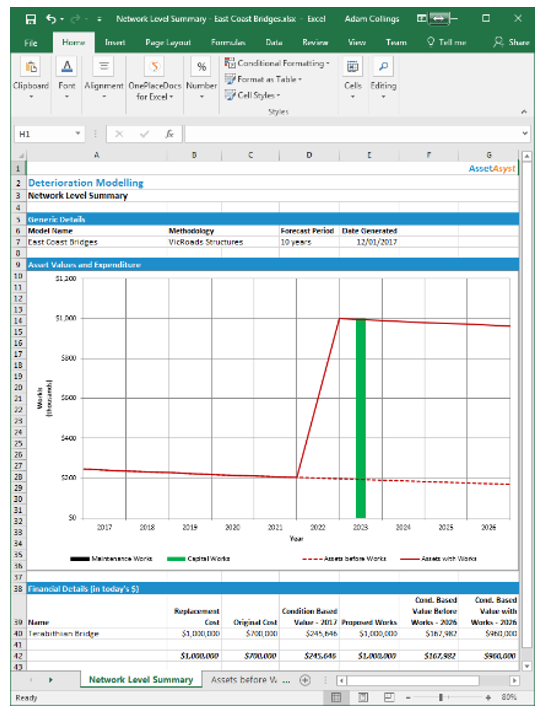
The Network Summary report will summarise information for all assets in the collection. It will also predict the replacement of structures. Automatic replacement of an asset will occur in the report if the asset has a replacement value, replacement structure class, and the condition-based value falls beneath 20% of the replacement cost. At this point, the report assumes the structure has been replaced, but since it cannot know what type of structure will replace the old one, it continues to depreciate the new asset on a straight-line basis from this point onwards.